Art's Charts June 23, 2025 at 07:30 AM
The S&P MidCap 400 SPDR (MDY) is trading at a moment of truth as its 5-day SMA returns to the 200-day SMA. A bearish trend signal triggered in early March. Despite a strong bounce from early April to mid May, this signal remains in force because it has yet to be proven otherwise... Read More
Art's Charts June 13, 2025 at 08:42 AM
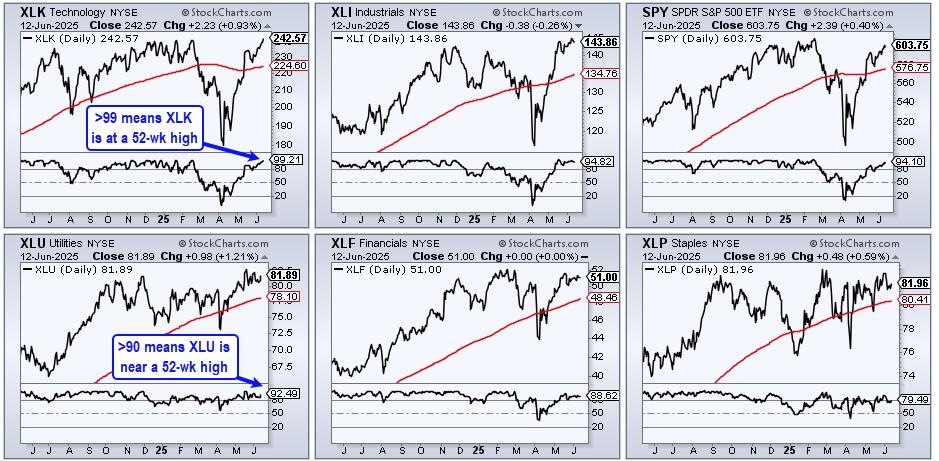
Three sectors stand out, with one sporting a recent breakout that argues for higher prices. Today's report will highlight three criteria to define a leading uptrend. First, price should be above the rising 200-day SMA... Read More
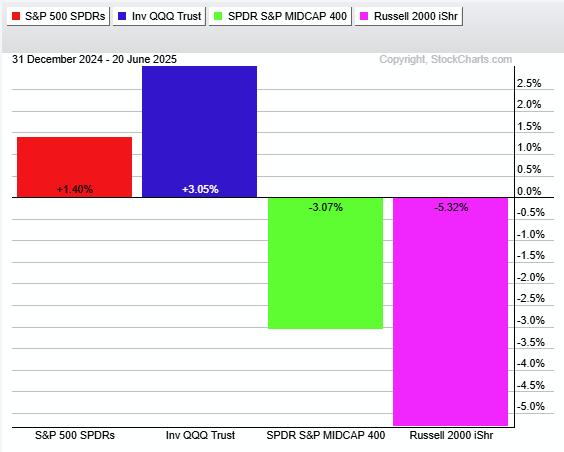
Art's Charts June 07, 2025 at 10:47 AM
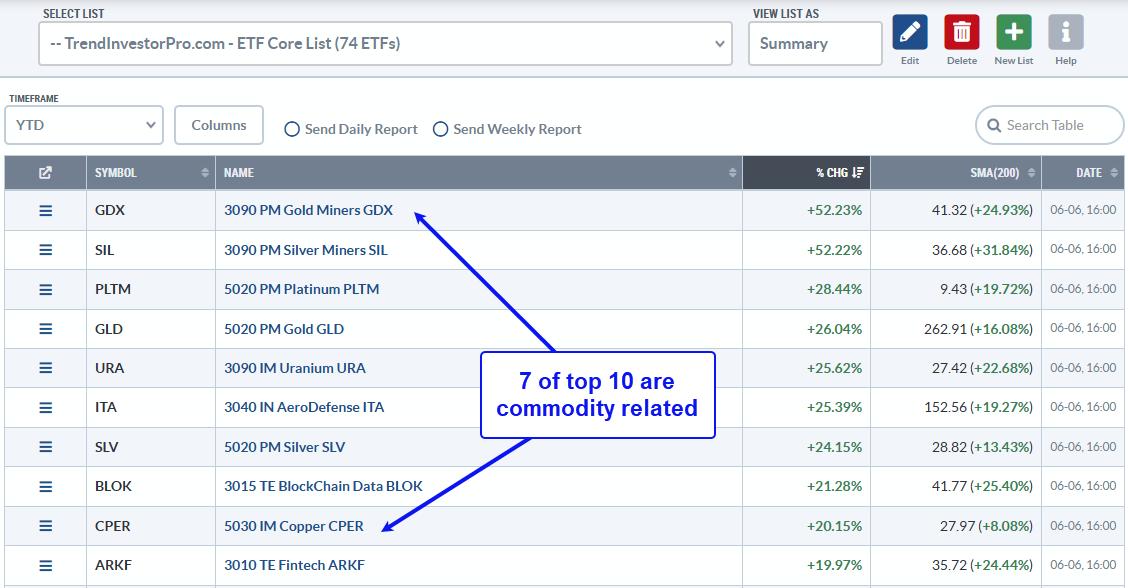
QQQ and tech ETFs are leading the surge off the April low, but there is another group leading year-to-date. Year-to-date performance is important because it includes two big events: the stock market decline from mid February to early April and the steep surge into early June... Read More